Broad deployment of artificial intelligence (AI) systems in safety-critical domains, such as autonomous driving and healthcare, necessitates the development of approaches for trustworthy AI. One key ingredient for trustworthiness is explainability: the ability for an AI system to communicate the reasons for its behavior in terms that humans can understand.
Early work on explainable AI includes well-known, model-agnostic explainers which produce explanations that remain valid for nearby inputs in feature space. Such approaches can produce explanations efficiently, however, they do not provide any formal guarantees and are thus inappropriate for use in high-risk scenarios. For instance, in healthcare, consider a dermatologist’s diagnostic model that claims to rely solely on a patient’s skin lesions, such as “plaque”, “pustule”, and “ulcer.” If, in actuality, patients with similar such lesions but different skin tones (“FitzpatrickI-II, III-IV, V-VI”) receive dissimilar diagnoses, then the explanation is not only wrong, but may actually mask bias in the model. Recent efforts towards formal explainable AI aim to compute rigorously defined explanations that can guarantee soundness, in the sense that fixing certain input features is sufficient to ensure the invariance of a model’s prediction. In our recent NeurIPS 2023 paper, we present VeriX (Verified eXplainability), a tool for producing optimal robust explanations and generating counterfactuals along decision boundaries of deep neural networks.
 |
|---|
| Figure 1: Intuition for our VeriX approach. Right: our VeriX explanation (green pixels) of “2”; masking white pixels or whitening black pixels may turn “2” into possible counterfactuals. |
We provide intuition for our VeriX approach by analyzing an example explanation in Figure 1. This explanation is generated for a fully-connected model trained on the MNIST dataset. Model-agnostic explainers such as Anchors rely on partitioning an image into a disjoint set of segments and then selecting the most prominent segment(s). Figure 1 (left) shows “2” divided into 3 parts using k-means clustering. Based on this segmentation, the purple and yellow parts would be chosen for the explanation, suggesting that the model largely relies on these segments to make its decision. This also matches our intuition, as a human would immediately identify these pixels as containing information and disregard the background. However, does this mean it is enough to focus on the salient features when explaining a classifier’s prediction? Not necessarily. VeriX ‘s explanation is highlighted in green in Figure 1 (right). It demonstrates that whatever is prominent is important but what is absent in the background also matters. We observe that VeriX not only marks those white pixels forming the silhouette of “2” but also includes some background pixels that might affect the prediction if changed. For instance, neglecting the bottom white pixels may lead to a misclassification as a “7”; meanwhile, the classifier also needs to check if the pixels along the left and in the middle are not white to make sure it is not “0” or “3”.
 |
|---|
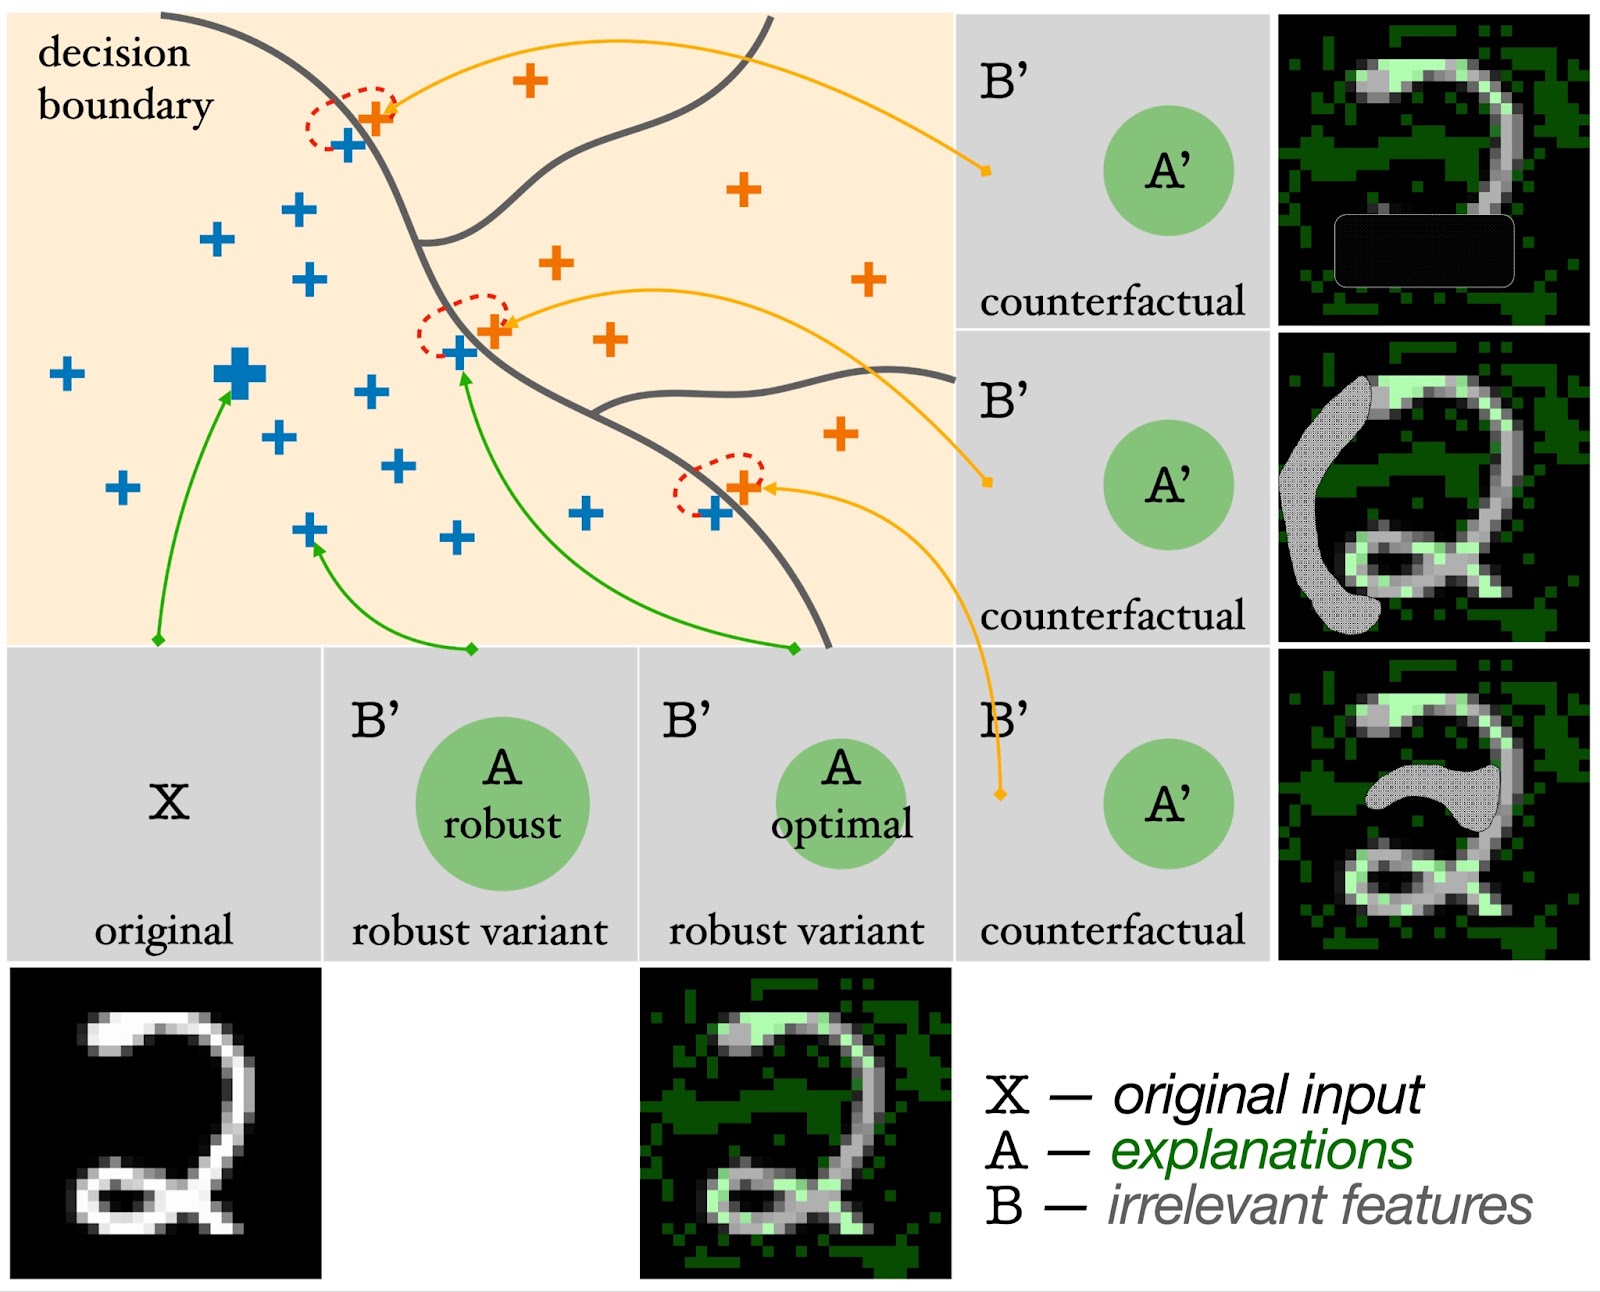
| Figure 2: Graphical illustration of VeriX . Each gray square denotes the original input X (big blue “+”) or a variant (smaller “+”). Variants (blue “+”) that do not change the explanation A (green circle) are guaranteed to lie on the same side of the decision boundary. Counterfactuals (orange “+”) with perturbed explanations A′ are classified differently. |
Our VeriX explanation is defined as a minimal subset of input features that are responsible for a model’s decision, in the sense that any possible perturbations on the rest features will never change prediction. We call such a locally minimal subset of input features an “optimal robust explanation” and refer to the disjoint rest as “irrelevant features”. That said, our explanations are both sound and optimal – sound in the sense that perturbations imposed upon the irrelevant features will never change the prediction (as shown by the small blue “+” variants in Figure 2), and optimal in the sense that perturbing the irrelevant features together with any feature in the explanation will breach the decision boundary of the model (as indicated by the pairs of blue and orange “+” variants in Figure 2).
We compute such explanations and counterfactuals iteratively using constraint solving techniques and a heuristic based on feature-level sensitivity ranking. In this blog, we will omit the algorithmic details of our methodology and instead focus on highlighting some of our interesting experimental results. More details can be found in our paper.
 |
|---|
| Figure 3: Optimal robust explanations (green) from VeriX on GTSRB (top) and MNIST (bottom) images. |
Figure 3 shows examples of VeriX explanations for GTSRB and MNIST images. Aligning with our intuition, VeriX can distinguish the traffic signs (regardless of whether it’s a circle, a triangle, or a square) from their surroundings well; the explanations focus on the actual contents within the signs, e.g., the right arrow denoting “keep right” and the number 50 as in “50 mph”. Interestingly, for traffic signs consisting of irregular dark shapes on a white background such as “road work” and “no passing”, VeriX discovers that the white background contains the essential features. We observe that MNIST explanations for the fully-connected model are, in general, more scattered around the background. This is because the network relies on the non-existence of white pixels to rule out different counterfactuals (Figure 3 shows which pixels in the explanation have associated counterfactuals with predictions of “8”, “5”, and “2”, respectively), whereas GTSRB explanations for the convolutional model can safely disregard the surrounding pixels outside the traffic signs.
 |
|---|
| Figure 4: Comparing VeriX (green) to Anchors (red) on two different versions of a “keep right” traffic sign from the GTSRB dataset, one with strong light in the background and one without. |
We compare VeriX with Anchors. Figure 4 shows both approaches applied to two different “keep right” traffic signs. Anchors performs image segmentation and selects a set of the segments as the explanation, making its explanations heavily dependent on the quality of the segmentation. For instance, distractions such as strong light in the background may compromise the segments (Figure 4, top right), resulting in less-than-ideal explanations, e.g., the top right region of the anchor (red) is outside the actual traffic sign. Instead, VeriX utilizes the model to compute the sensitivity traversal, often leading to more reasonable explanations. Anchors is also not designed to provide formal guarantees. In fact, replacing the background of an anchor explanation – used by the original paper to justify “almost” guarantee – can change the classification. For example, the bottom right of Figure 4 is classified as “yield” with confidence 99.92%. In contrast, VeriX provides provable robustness guarantees against any ϵ-perturbations in the input space.
 |
|---|
| Figure 5: Deployment of VeriX in an autonomous aircraft taxiing scenario. Pictures taken from the camera fixed on the right wing are cropped (red box) and downsampled. Each sampled camera view is presented with its VeriX explanation. |
We also applied VeriX to the real-world safety-critical aircraft taxiing scenario shown in Figure 5. The vision-based autonomous taxiing system needs to make sure the aircraft stays on the taxiway utilizing only pictures taken from the camera on the right wing. The task is to evaluate the cross-track position of the aircraft so that a controller can adjust its position accordingly. We trained a fully-connected regression network on this dataset, referred to as the TaxiNet model, to predict the aircraft’s cross-track distance. Figure 5 exhibits VeriX applied to the TaxiNet dataset, including a variety of taxiway images with different heading angles and number of lanes. We observe that the model is capable of detecting the more remote line – its contour is clearly marked in green. Meanwhile, the model is mainly focused on the centerline, which makes sense as it needs to measure how far the aircraft has deviated from the center. Interestingly, while we intuitively might assume that the model would focus on the white lanes and discard the rest, VeriX shows that the bottom middle region is also crucial to the explanation. This is because the model must take into account the presence and absence of the centerline. This is in fact consistent with our observations about the black background in MNIST images (Figure 1).
VeriX is a framework for computing optimal robust explanations and counterfactuals along the decision boundary. Our approach provides provable guarantees against infinite and continuous perturbations. A possible future direction is generalizing to other crucial properties such as fairness. Recall the diagnosis model at the beginning of this blog; our approach can discover potential bias (if it exists) by including skin tones (“Fitzpatrick I-II, III-IV, V-VI”) in the produced explanation; then, a dermatologist could better interpret whether the model is producing a fair and unbiased result.